The U.S. hotel transaction market has come back at a brisk pace. The equity raised over the past 16 months is being deployed competitively, lenders are financing again, and hotel performance experienced a strong recovery through the summer months. There are still COVID-19-related headwinds that the transaction market must battle, but the sentiment is good, and we are optimistic that this trend will continue moving forward. Deal volume is not at a point where it exceeds pre-COVID numbers, but if this rapid pace continues, we could see a full recovery in transaction volume by year-end 2022.
Contributed by Eric Guerrero, managing director, HVS Brokerage & Advisory, Houston
In this article, we review some of the key trades so far this year and, specifically, where the deals are happening geographically. Looking at the transaction data, there were US$25.5 billion in hotel transactions year-to-date through August 2021, reflecting a 261% increase to last year and paralleling the lodging industry’s performance recovery. Two important aspects that have contributed to this trend are that (1) a buyer can have an immediate going-in yield given that the asset is producing a positive cash flow, and (2) leisure markets are projected to continue to outperform corporate-driven markets, supporting a credible pro forma.
Let’s look at the YTD August 2021 hotel performance for the top 25 markets. As an aggregate, the U.S. market registered an average occupancy of 57.1%, ADR of US$120.17, and RevPAR of US$68.56. This represents a 28% increase in occupancy and 44% increase in RevPAR, compared to the same period last year. The top five markets for YTD occupancy were Tampa, Florida (70%); Miami, Florida (67.6%); Norfolk/Virginia Beach, Virginia (63.7%); Los Angeles, California (61.9%); and Phoenix, Arizona (61%). These five markets are all major leisure destinations within the United States. With there still being international travel restrictions in many countries, domestic leisure travel is expected to continue to remain strong, and these markets should continue to outperform the rest of the nation.
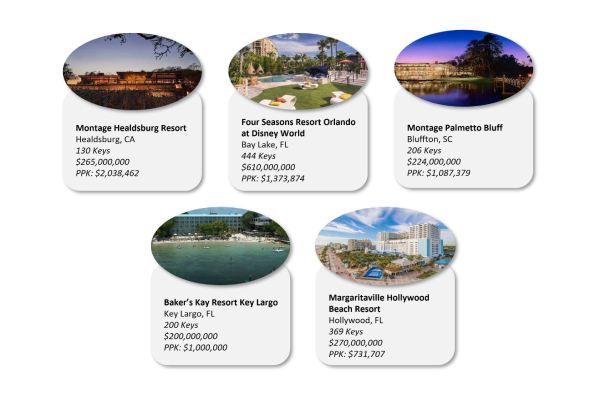
When surveying the top five price-per-key trades this year, all of them were located in strong leisure markets and were acquired by REIT or institutional investors. These sales represent the highest per-key pricing that we have seen since the start of the pandemic and illustrate the long-term belief in markets like this.

Source: Real Capital Analytics
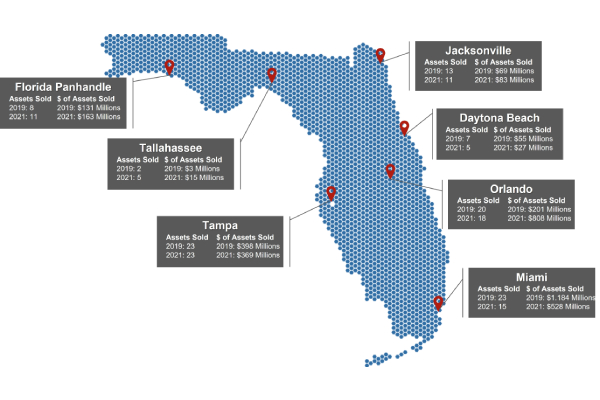
Looking at the most active markets in the country thus far this year, Florida stands out as one of the most active states. The following data illustrates how quickly investor interest has shifted toward leisure markets. Four out of seven markets below have experienced an increase in transaction volume this year. It is important to point out that data reflects the number of assets sold and the amounts in 2019 versus the number of assets sold and the amounts through the YTD August 2021 period (eight months).

Source: Real Capital Analytics
With the COVID-19 variants becoming a concern for employers, the return to the office and, ultimately, the return of business travel is unknown at this time. Given this, we expect investors to continue to flock to strong leisure markets over the next twelve months. Based on conversations that we are having with active buyers in the market, the general consensus is that for the right asset in the right market, they are willing to stretch on pricing to win a deal. They are willing to accept a lower going-in yield for a more predictable cash flow. As we look at our own transaction pipeline, we had significant investor interest in a Marriott portfolio of limited-service assets in Galveston, Texas, where they traded at 15% over the pricing guidance. A client is also amid active negotiations to purchase a boutique asset in Santa Fe, New Mexico, which received strong investor interest through a targeted marketing process.
Another interesting trend that we believe will continue in leisure markets is the increase in full-service asset sales. From the onset of the pandemic, limited-service assets dominated the transaction market. However, looking at just the month of August, full-service hotels experienced a 442% increase in transaction volume (US$1 billion) versus a 102% increase for limited-service hotels (US$700 million).
