
2022 saw U.S. hotel profit margins jump. This year, they’ve taken a step back.
From January through July of 2022, hotels in the U.S. saw gross operating profit (GOP) margin increase by 9 percentage points year-over-year, moving from 30.3% to 39.3%. However, the story is very different when we look at the current year’s performance: In the first seven months of 2023, GOP margin decreased by 1.2 percentage points to 38.1%. And even though this number is still higher than the results of 2021, it is an early warning sign that cost pressures are on the rise and hoteliers should take a close look at resource allocation during the upcoming budgeting process.
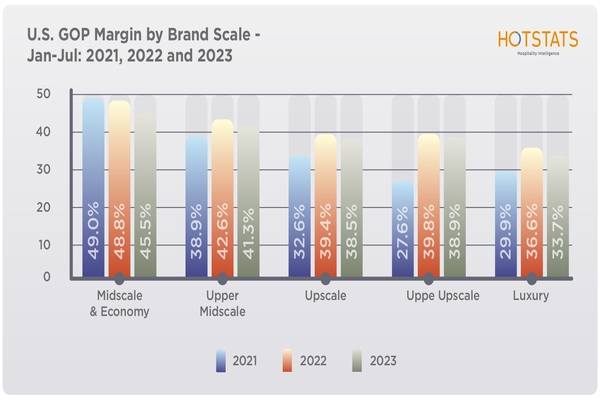
Disaggregating the data by brand scale shows that this margin contraction is not homogeneous. While the upper-upscale and upscale segments had YOY margin falls of 0.9 percentage points each, the extremes exhibited much deeper declines: 3.3 percentage points in the case of midscale and economy and 2.9 percentage points in the case of luxury.
Labor costs are key in understanding the downward trend in margins. As depicted in Figure 2, the YOY growth in labor costs vastly outpaces the growth in total revenue on a per-available-room basis. Moreover, for midscale and economy properties, this spread resulted in a 3.7% GOPPAR decrease, while luxury properties achieved a meager 0.8% YOY GOPPAR uptick.

When we look at performance by geography, the data show disparate results. To have a more holistic understanding of the profitability story, we present a matrix that tracks the percentage change in two key dimensions: TrevPAR (measured on the horizontal x-axis) and GOP margin (measured on the vertical y-axis). The results are based on state-level data for New York (NY), Pennsylvania (PA), Massachusetts (MA), California (CA), Texas (TX), Illinois (IL), Florida (FL), Georgia (GA), Ohio (OH), Louisiana (LA), Arizona (AZ) and Washington (WA). Our objective is to see not only how revenue and margins evolved as separate performance indicators, but also the interaction between revenue generation and conversion to profit.
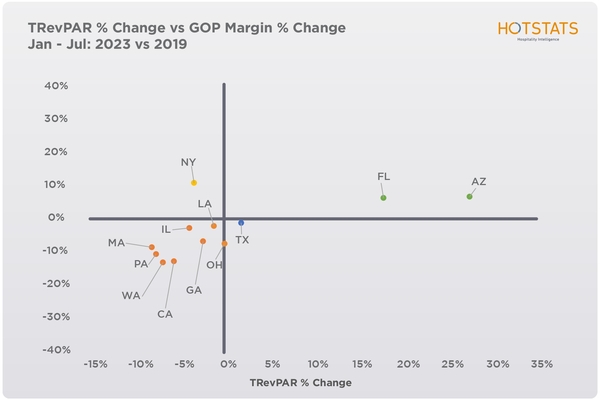
Figure 3 shows the percentage difference in the two dimensions for the period January through July 2023 compared to 2019, as a way to visualize where each state stands in terms of recovery to pre-pandemic levels. Only three states in the sample achieved a higher TRevPAR in 2023 than in 2019: Texas, Florida and Arizona. The key difference between these three is that while Florida and Arizona were also able to grow their margins, Texas was not, which points to a flow-through problem in the Lone Star State. The rest of the sample is still below 2019 in terms of revenue generation, but New York stands out as a flex success: the only state in this group that managed to grow its profit margin despite the top-line contraction.
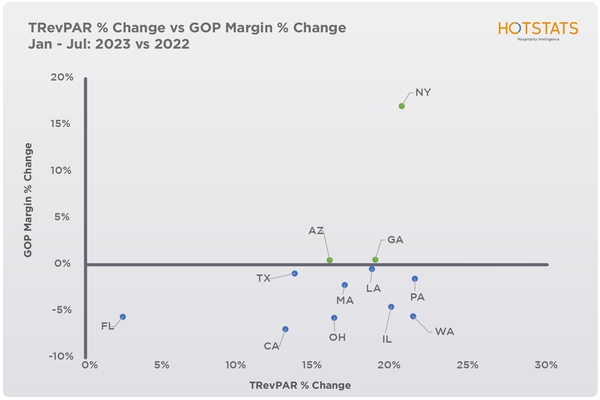
Figure 4 is the same matrix but using 2022 as the base year instead of 2019. Notably, all the states achieved YOY TRevPAR growth, so the states are only divided by whether they were also able to increase their margins or not.
A closer look at the pattern of TRevPAR growth shows that most states that are behind when compared to 2019 exhibited the greatest YOY increase. Illinois, New York, Pennsylvania and Washington. This is propitious news for these relegated states, as 2023 is marking the start of the path towards top-line recovery. In the case of Florida, even though its TRevPAR growth is significant compared to its pre-pandemic level, the YOY increase was much more subdued and signals a plateauing of its revenue expansion trend.
Despite the TRevPAR growth across the board, most states achieved lower margin results in 2023 when compared to 2022. This raises concerns over the ability of hotels to contain costs as revenue grows. Of particular concern are Florida, California, Ohio, Illinois and Washington: They have the greatest margin decreases of the sample, ranging from 7% to 5% below 2022 levels. The state of New York, on the other hand, again stands out for its margin improvement.

There is a direct link between the YOY margin results and the evolution of labor costs in the same period. In the case of New York, while still exhibiting the greatest labor cost percentage of the sample, it was also the only state where that percentage declined in 2023, by 2.5 percentage points, as Figure 5 shows. On the other end of the spectrum, it is no surprise that Florida, California, Washington, Ohio and Illinois experienced the greatest percentage point increases.
No matter how we slice and dice the data, there is a clear takeaway from the results: Profitability is not a by-product of revenue. Even with an expanding YOY top-line, cost creep, particularly in labor, is eroding margins. In this context, it is ever more pressing for hoteliers to understand where they sit within their competitive landscape and enter budgeting season with a full understanding of how each dollar they allocate to specific expense lines will help not only drive value for guests, but contribute to optimizing flow-through and owner returns.
Story contributed by Laura Resco, director of hotel intelligence – Americas, HotStats.