
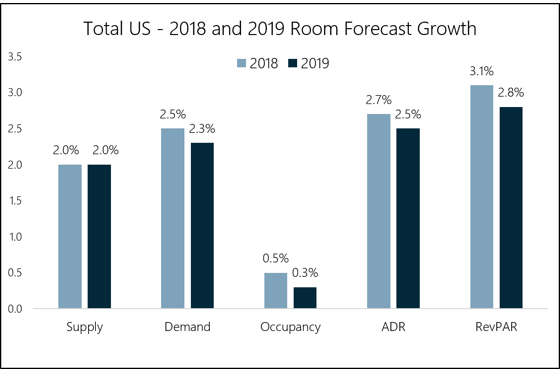
Heading into 2019, when looking at the traditionally tracked metrics of hotel-collected RevPAR, ADR, and occupancy, we expect the U.S. lodging industry to perform generally in line with the last several years.
Supply growth looks to remain steady at the long-term average and demand should continue to outpace the level on new room growth by a small amount resulting in rising occupancy. In fact, national occupancy numbers will again reach all-time high levels since performance data began being accurately tracked in the 1980s. Therefore, that supply/demand relationship will remain strong, which is the primary driver of ADR and RevPAR growth, however at levels well below what the underlying fundamentals would suggest.
While there are many factors at the root of the sluggish room rate growth over the past several years, one of the more compelling drivers has been the rapid shift in the way customers book hotel rooms. In 2019, at a national level, more than half of all hotel bookings will be made online versus only 35% just four years ago. This has a perceived effect on pricing power at the property level and the associated cost of the bookings is greatly impacted.
Specifically, in the same four-year time frame, more than 201,400 rooms booked per day have shifted to another channel away from the direct property, the most direct means of booking a reservation via walk-ins or phone calls handled directly by the front desk staff. That level of change in such a short time period is staggering and will continue to have a profound effect on ADRs and hotel profitability.
Generally, that shift in booking behavior has resulted in increased reservations through either brand.com or the OTAs. On a per room night basis, in the same time frame, the average daily rooms booked through brand.com has risen by approximately 203,000 rooms booked per night compared to an increase of about 186,000 rooms booked per night through the OTAs. Further analysis of these results displays an increase of about 270,000 incremental rooms booked per night, in absolute room night demand over the same four-year period.
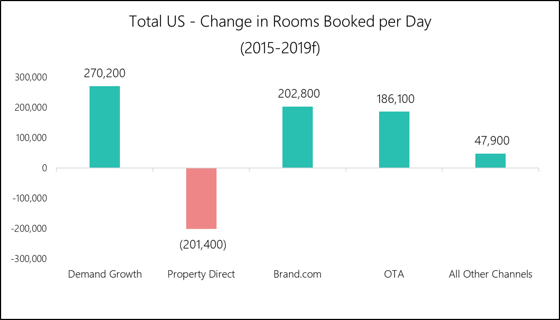
The chart just above shows the change in room night booking demand by channel between 2015 and our forecast for 2019. It’s clear that the majority of the change in consumer behavior is happening in three main channels. It must also be pointed out that while an examination of this dynamic by market or property type would reveal considerably different magnitudes of change, the underlying pattern would be the same.
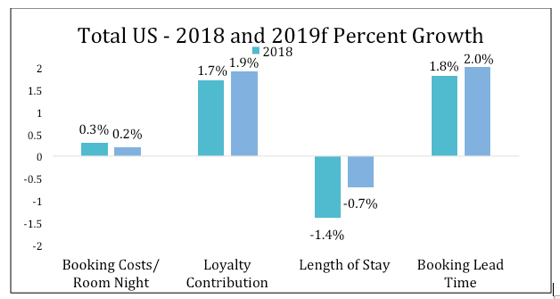
As shown just above, booking costs per room (measured as the costs directly associated with the booking, like wholesale commissions, retail commissions, loyalty investment and channel costs) will continue to rise in 2019. While these costs, aggregated at the national level, are a blended result of all the booking channels, the costs associated with certain channels are increasing at a faster rate than others, both from an absolute cost perspective as well as a booking volume perspective.
In 2019, the industry will continue to see increases in loyalty contribution, or the percentage of bookings made by loyalty program members, which we expect will rise about 2% to just under 50% of all room night bookings. Again, this is a meteoric rise from just five years ago when industry wide loyalty contribution was about 40%. Also shown above, we project the change in booking lead time, up slightly over 2018 and average length of stay, which should remain mostly flat over the prior year.
With modest changes in most metrics year-over-year, it’s important to further analyze more advanced metrics that can give context and nuance to the standard industry metrics, and when actioned correctly, can potentially drive more net RevPAR.
Contributed by Mark Lomanno, partner and senior advisor, Kalibri Labs, Rockville, Maryland